we are running serveral OpenNebula Instances within our Datacenters.
Our current capacity management is built on top of some Excel Sheets which show us
REAL vs. ALLOCATED vs. USED. This is odd.
All other Services (running on top of the OpenNebula IaaS-Stack) have their own Graphite Metrics collected and pushed them to shiny and cool Dashboards (like Dashing.io).
I think the same solutions (for example ONE Graphite-Metrics out of the Box) for OpenNebula will be quite nice.
It could be a shiny solution for providing long-term statistics and a base for Capacity management.
What do you think? What do you use for capacity management?
For example, a small patch of im/kvm-probes.d/kvm.rb with some lines of code could generate the Metrics for these kind of statistics? But will this be the right place to gather this stats? Are there any other sources?
The probes might not be the best place to add custom code. They run in the the host, not the front-end, and you don’t have internal OpenNebula data that you may want to collect, such as allocated memory.
I’d consider a cron job running in the front-end. The ruby api or the onehost list -x output will provide all the info you need to parse.
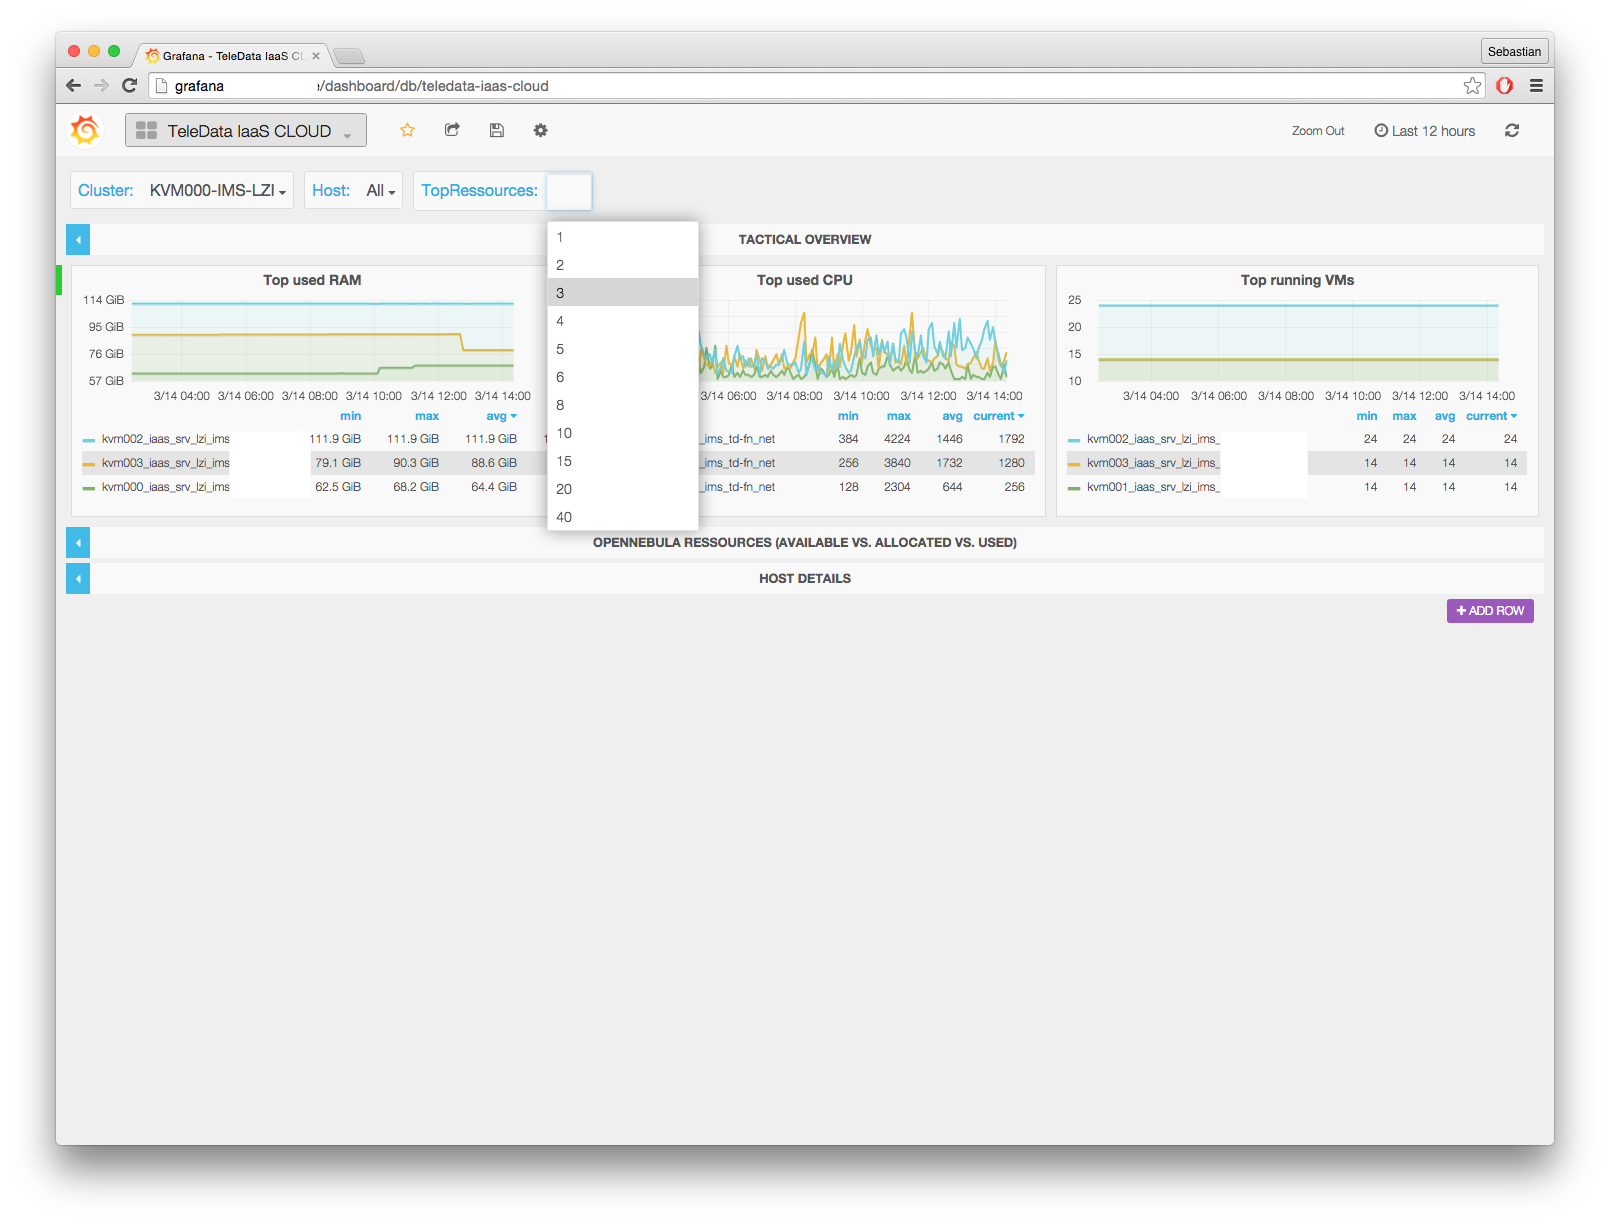
i created a small ruby class/script which pulls the desired informations out of OpenNebula (parsing the XML output of onehost list -x ). The desired values are pushed to graphite and i can play with the metrics. Currently there are only some Grafana Dashboards where you can filter for “Top Ressources” (for example “display the most loaded host” or “display the X hosts with most USED_MEM”). The next steps will be to create some graphs for capacity management and develop a nice Dashing.io dashboard for our big screens. Perhaps i will share the informations as a new post at your blog ( http://opennebula.org/blog/ ) - interested?
See some screenshots of the first graphed metrics:
That looks great!! Details on this kind of development are always welcomed in our blog. Please send me an email address to dmolina@opennebula.org and I will create an account for you.
of course i will share it. But currently i had to finalize it. The first Grafana-Dashboards are finished (with templating, filter for top resources, drilldown VMM host and capacity planning (N+1 redundancy). The next thing is to develop a Dashing dashboard with some interesting metrics.
My goal is to produce some content for the OpenNebula Blog (@dmolina: i already have a acccount “Sebastian Mangelkramer”).
I will publish a short howto and everyone can play with it.